Recently, I checked the access data of the blog Google Analysic, and through traffic analysis, I found some very interesting points that can reflect, to some extent, the user characteristics in game development using Unreal Engine. The data sample in this article is the access traffic from our site for the week of 2021.11.14-2021.11.20. The overall data amount is limited and may not truly reflect real trends, only for reference.
My blog has been continuously updated for 7 years. Although I integrated Google Analysis quite early, the traffic was limited before, mainly used as personal notes, without statistical significance. As the site content has been updated, traffic has also increased, averaging a few hundred PVs daily, and around five to six thousand monthly. As a niche technical site focused on game development, Unreal Engine, and C++, this data is fairly decent.
Time Distribution
Traffic volume at different times of the day:
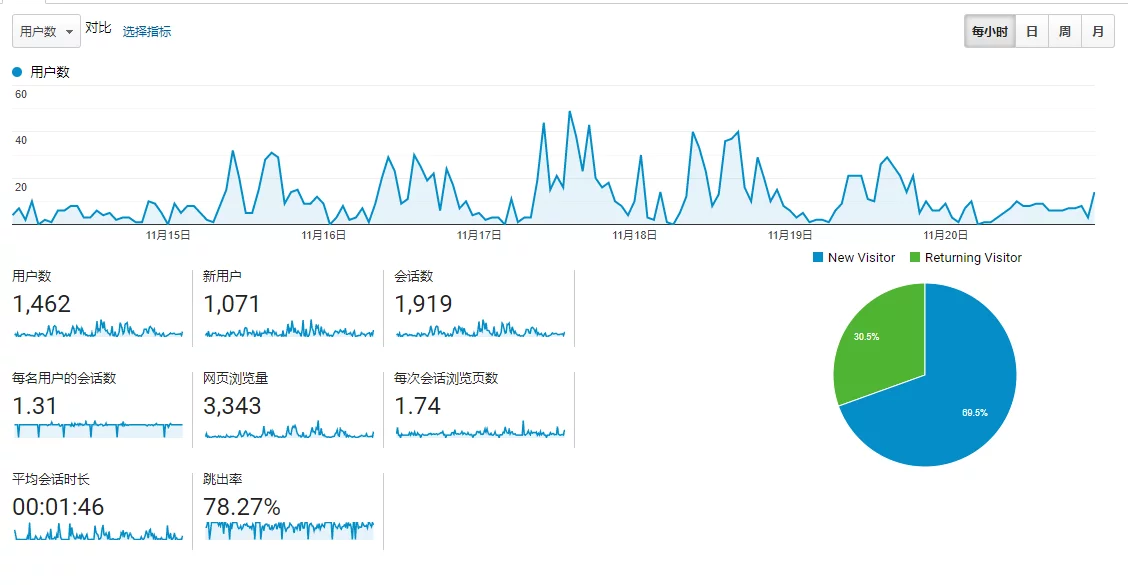
It presents a peak-and-valley pattern, with peak visits occurring between 10 AM and 11 PM, and a noticeable decline at 8 PM.
There is a significant decline trend on weekends:
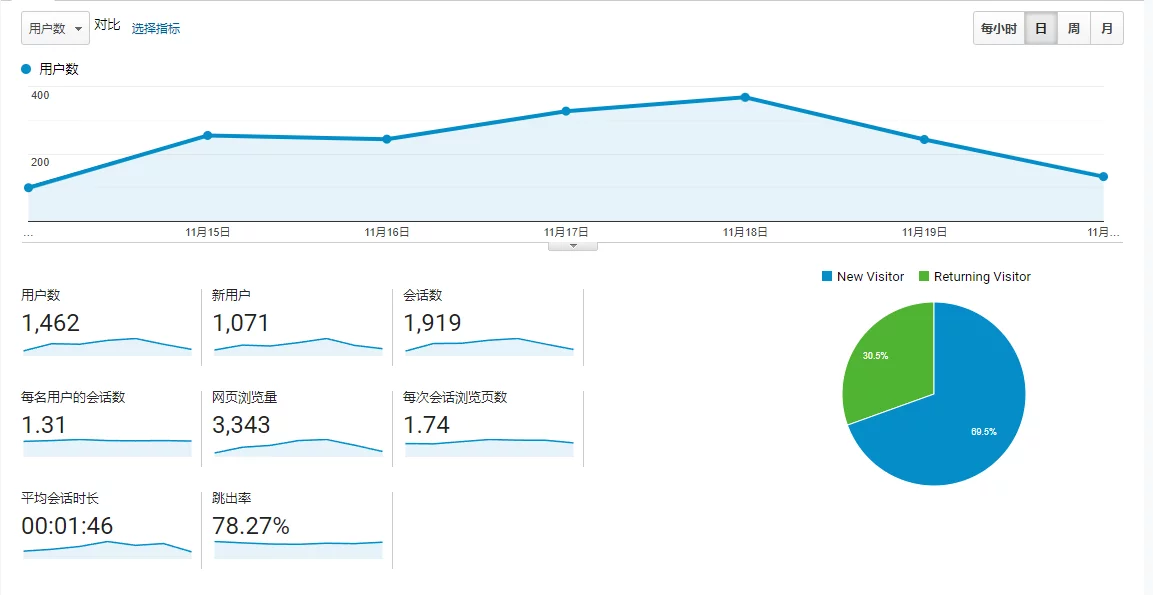
It indicates that technology is not studied on weekends, which suggests that there are still many companies with two-day weekends.
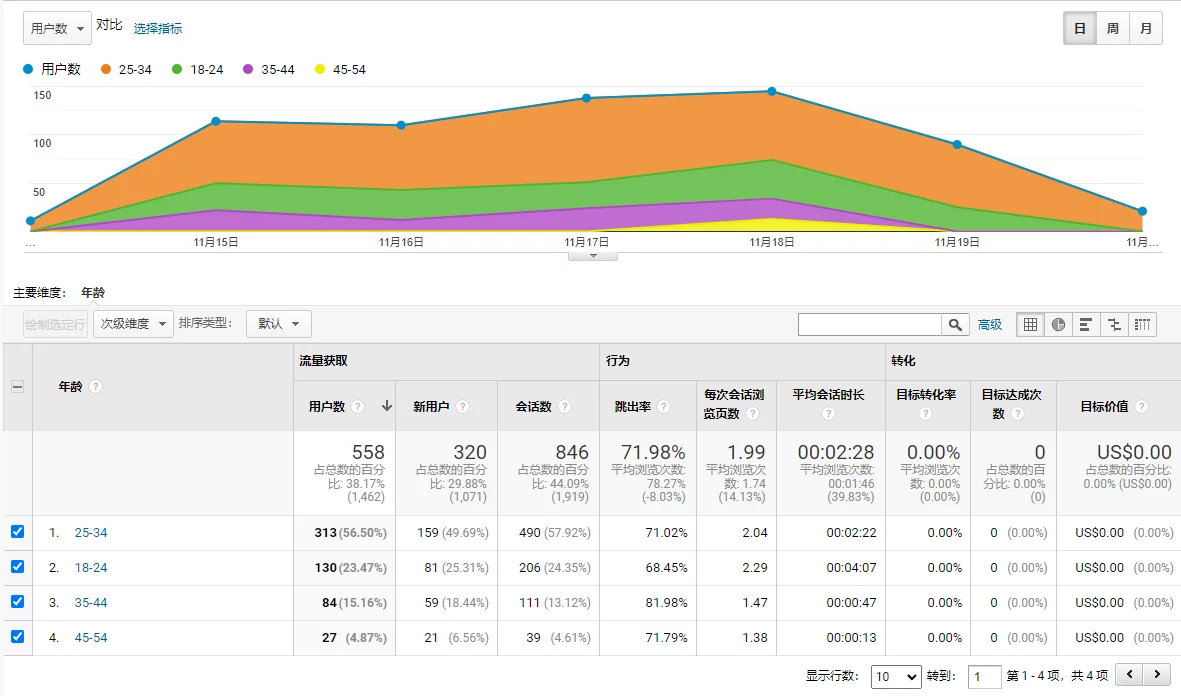
Age Distribution
Visitor age, with 25-34 being the main group, and a noticeable decline after 35, is this the mid-life crisis for tech people?
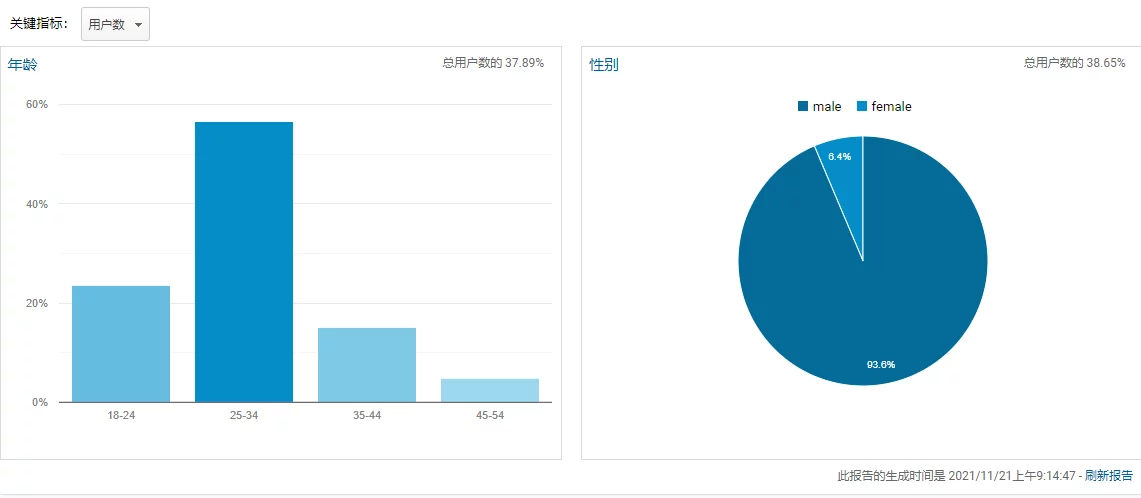
Moreover, male visitors make up the absolute majority, reaching 93.6%, indicating a gender imbalance in the industry.
Regional Distribution
The geographical distribution of site visitors, with Mainland China being the majority, followed by the U.S., Japan, and South Korea:
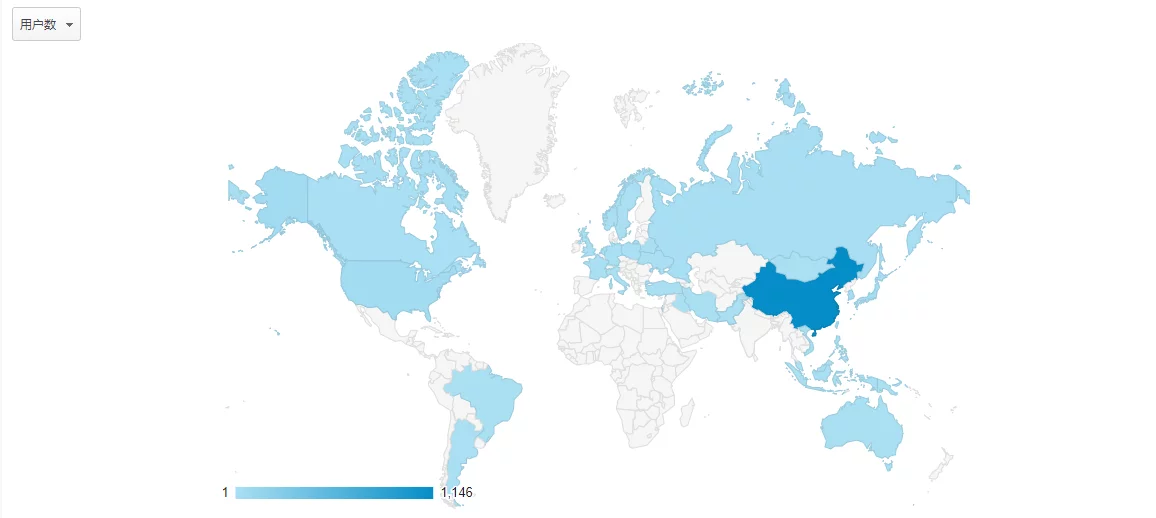
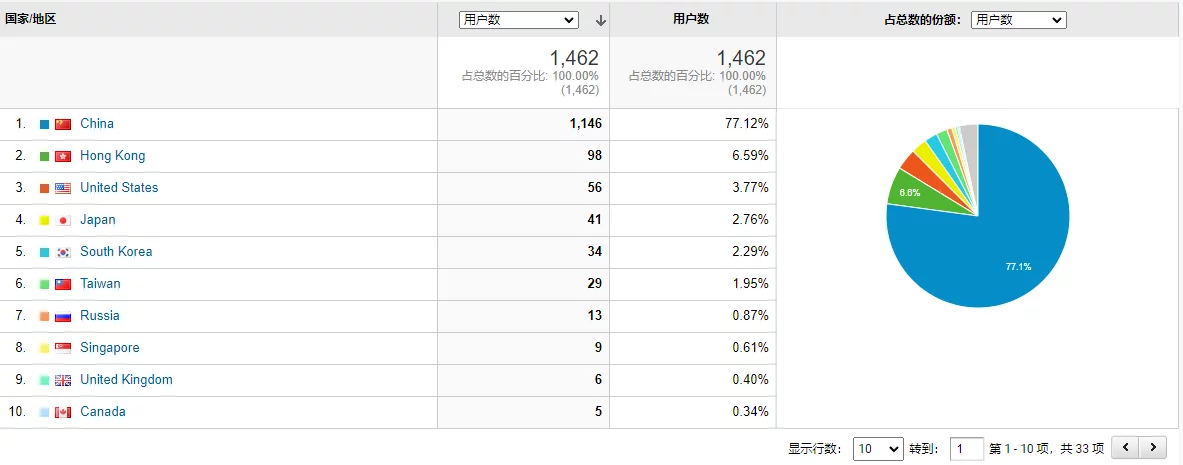
I will refrain from discussing the Mainland part for now; foreign visitors are mainly concentrated in North America, Northern Europe, and Southeast Asia, and surprisingly, there are also visitors from South America, while Africa and North Korea are completely blank :)
Although the original articles on my blog are in Chinese, I integrated Google Translate, supporting full-text translation into English, Japanese, Korean, and Russian. Judging by the traffic and comments, there are still some foreign visitors, though we cannot rule out the possibility of VPN users.
The domestic access situation mainly clusters around the eastern coastal areas centered on Beijing, Shanghai, and Shenzhen:
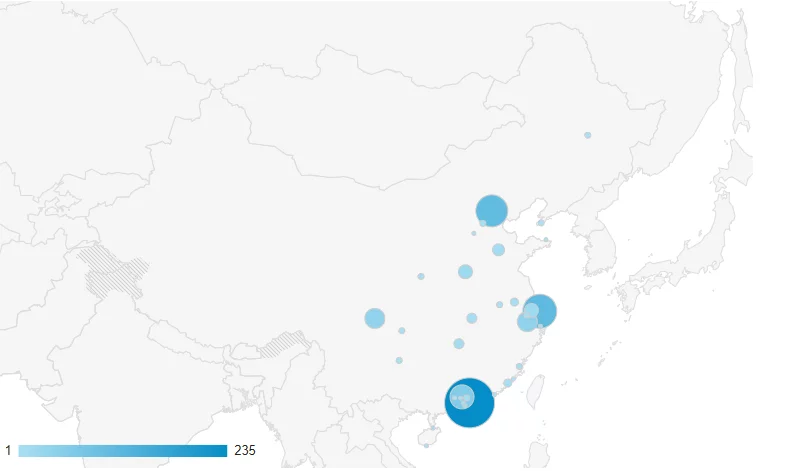
The three cities of Beijing, Shanghai, and Shenzhen account for 70% of the total traffic.
Other second-tier cities in order are: Guangzhou, Hangzhou, Chengdu, and Suzhou. The remaining sporadic distributions are in central cities, and interestingly, there is almost none in the northwest and northeast. In game development and Unreal Engine, first-tier cities account for the absolute majority.
Devices and Browsers
Chrome has the absolute majority: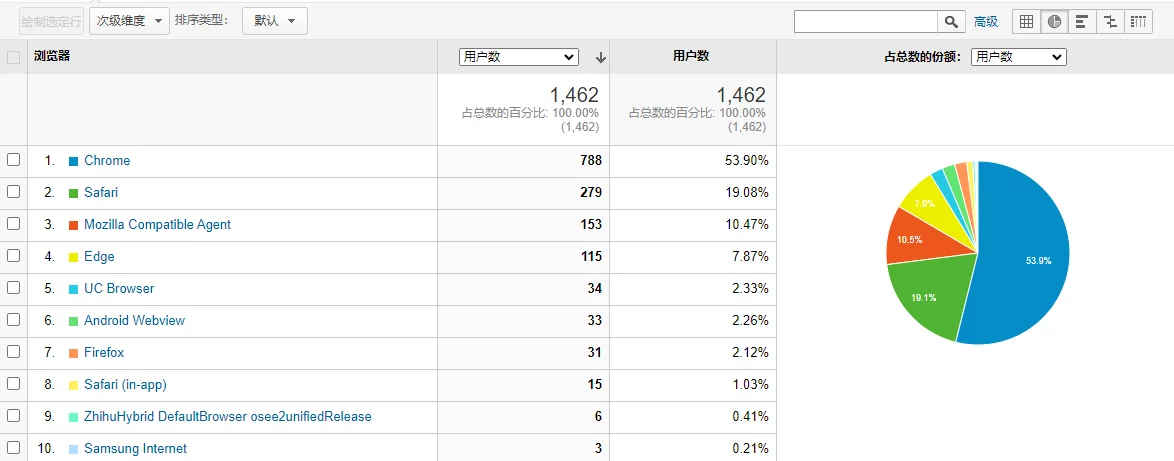
Desktop users far exceed mobile users, indicating that it seems rare to read technical content on mobile: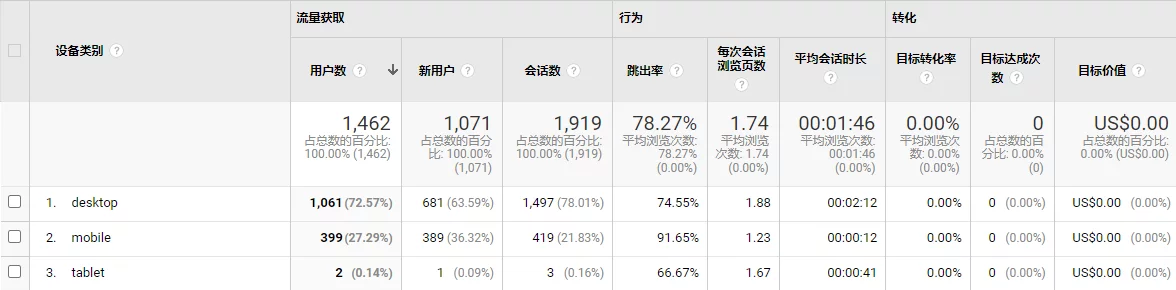
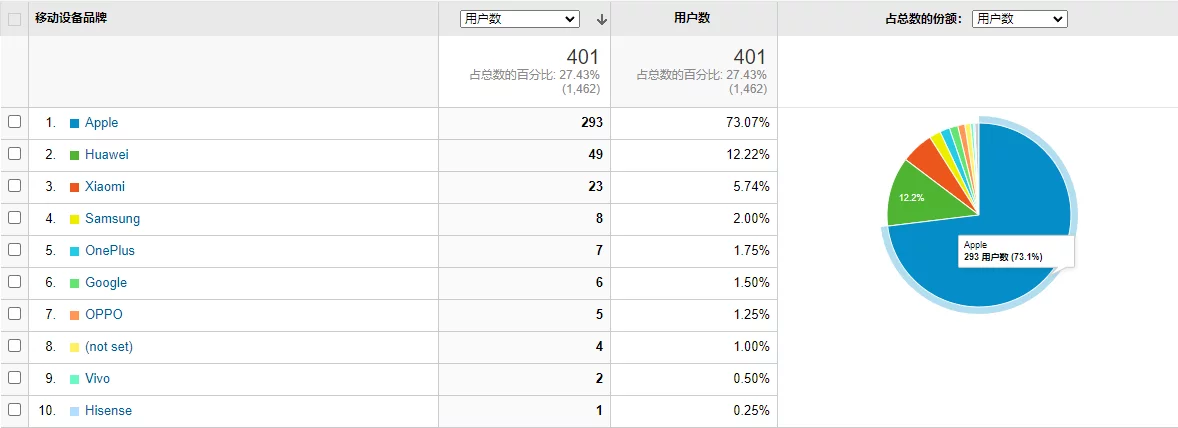
Among mobile visitors, iPhone accounts for 70%:
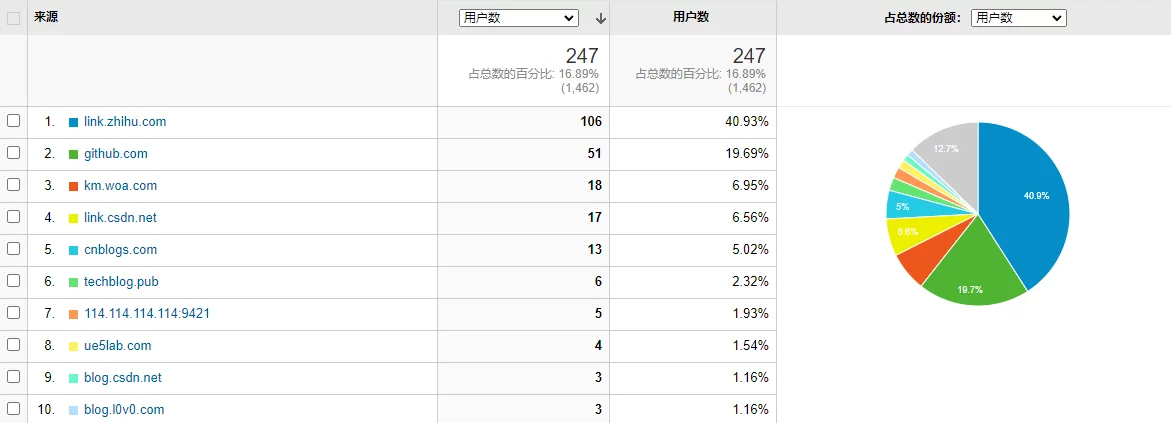
Traffic Sources
Direct access through the domain and through search engines accounts for 83.4%: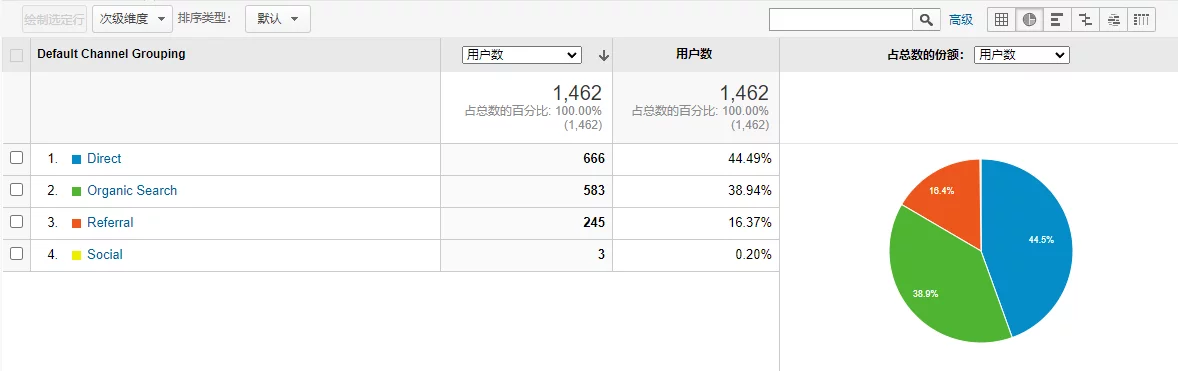
Other traffic sources include link redirections, Zhihu, GitHub, Baidu search, KM: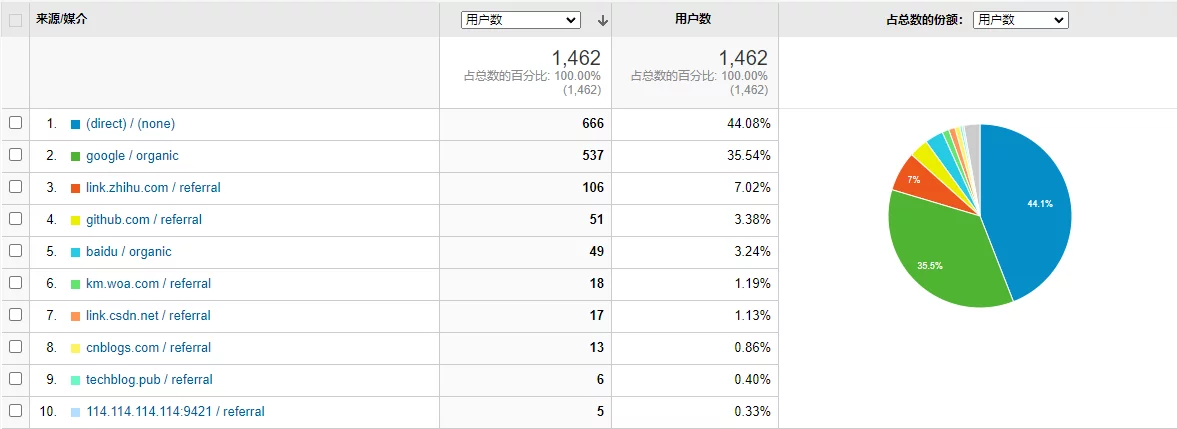
The main traffic source from Zhihu is the Unreal China weekly report, while GitHub is from the links in my open-source projects, contributing less than 10% to total traffic, but accounting for 60% of referral traffic.
Content Trends
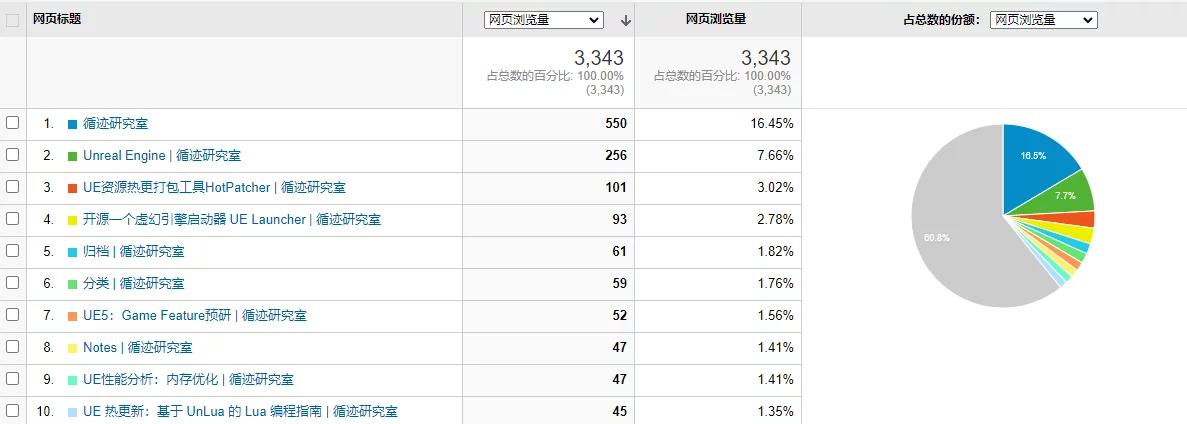
Traffic since page statistics were introduced in 2021: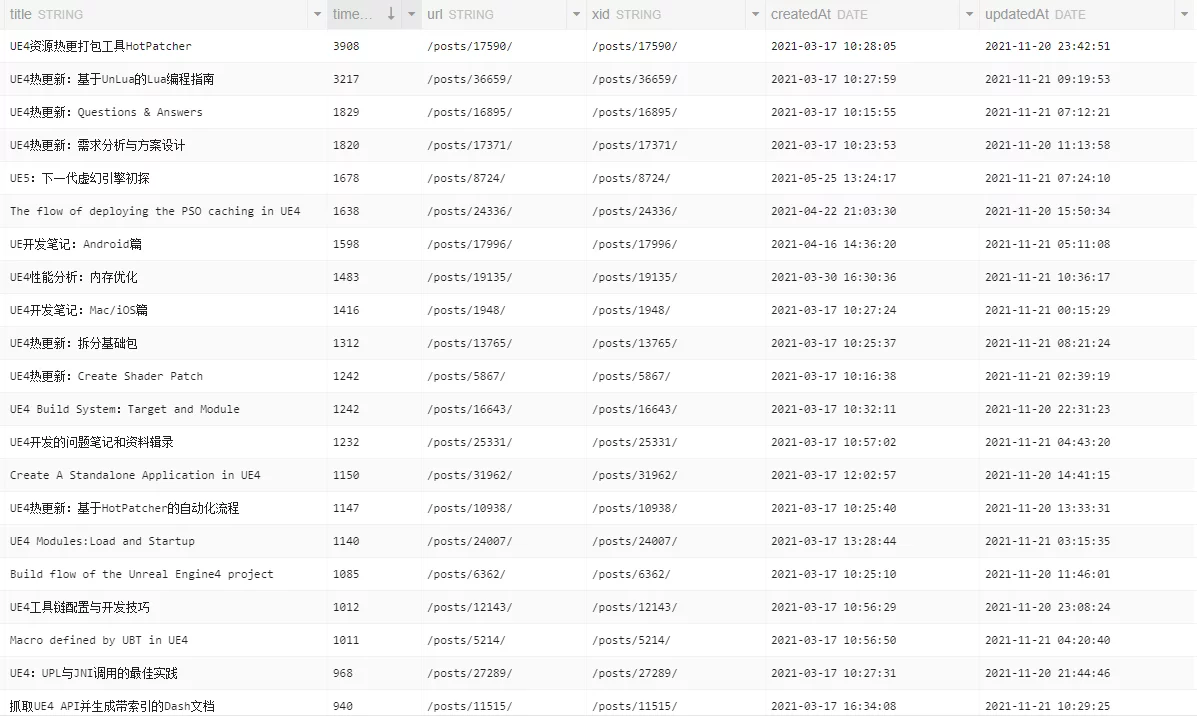
The traffic proportion for my hot update solution series is the largest, followed by articles on engineering practices, with newly published articles having incremental advantages.
Landing page analysis, the situation where visitors jump from popular pages to other articles: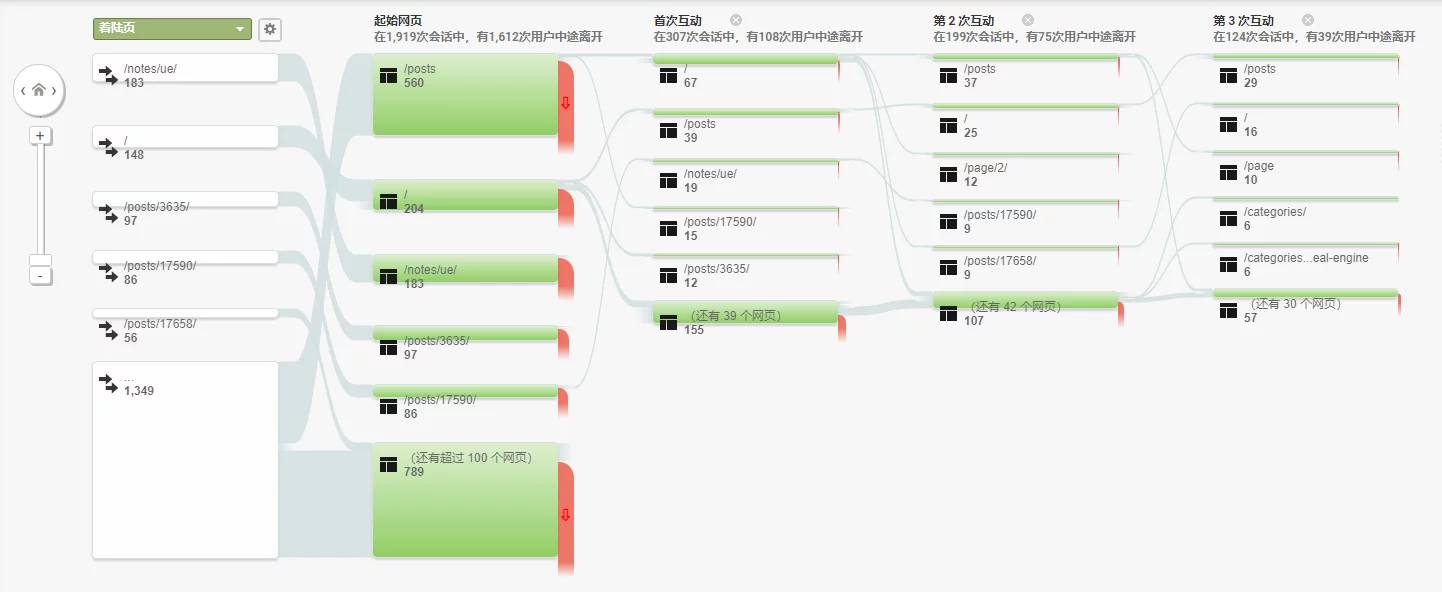
There is a high demand for content relevance.
Summary
A simple analysis of the blog traffic across various data points allows us to draw some user profiles of my blog visitors:
- The main users are distributed in Beijing, Shanghai, and Shenzhen, followed by Guangzhou, Hangzhou, and Chengdu.
- The majority are male users, predominantly aged 25-35.
- Direct access and search engines contribute most of the traffic, while the Zhihu Unreal Weekly Report and GitHub project README have a low referral share.
- Access time mainly ranges from 10 AM to 8 PM, indicating some overtime scenarios.
- Foreign visitors are concentrated in the U.S., Japan, South Korea, and Southeast Asia.
- Articles on hot updates and engineering techniques account for a high proportion of website traffic.
- Chrome, Safari, and Firefox browsers have high shares.
- Mobile visitors are dominated by iOS over Android.
Conclusions drawn from data analysis:
- In game development focused on Unreal Engine, first-tier cities have more opportunities, followed by Hangzhou and Chengdu.
- The low proportion of users aged 35 requires attention to the mid-life crisis of tech professionals.
- There is a high demand for practical engineering and technique articles, making it feasible to continuously publish such content.
- Landing page redirection requires high content relevance, and series content has advantages.
Through data analysis, valuable insights can indeed be obtained, guiding practice, and I encourage all visitors to continue learning together.